
Selecting the right B2B buying network metrics enables procurement teams to monitor supplier performance, commercial outcomes, and sourcing quality, rather than only reporting on procurement activity. However, many procurement dashboards reflect activity because it makes teams look busy.
Deloitte’s report finds that despite technology budget for procurement increasing by 24%, procurement leaders face challenges in proving its worth for business value. B2B teams that fail to defend their technology ROI often fail to measure their delivery value.
A 20-metric procurement dashboard is weaker than a 5-metric dashboard because it is built on activity data that remains disconnected from commercial outcomes, whereas the latter brings discipline to sourcing decisions.
Which Are the Procurement Metrics Every Procurement Team Should Track
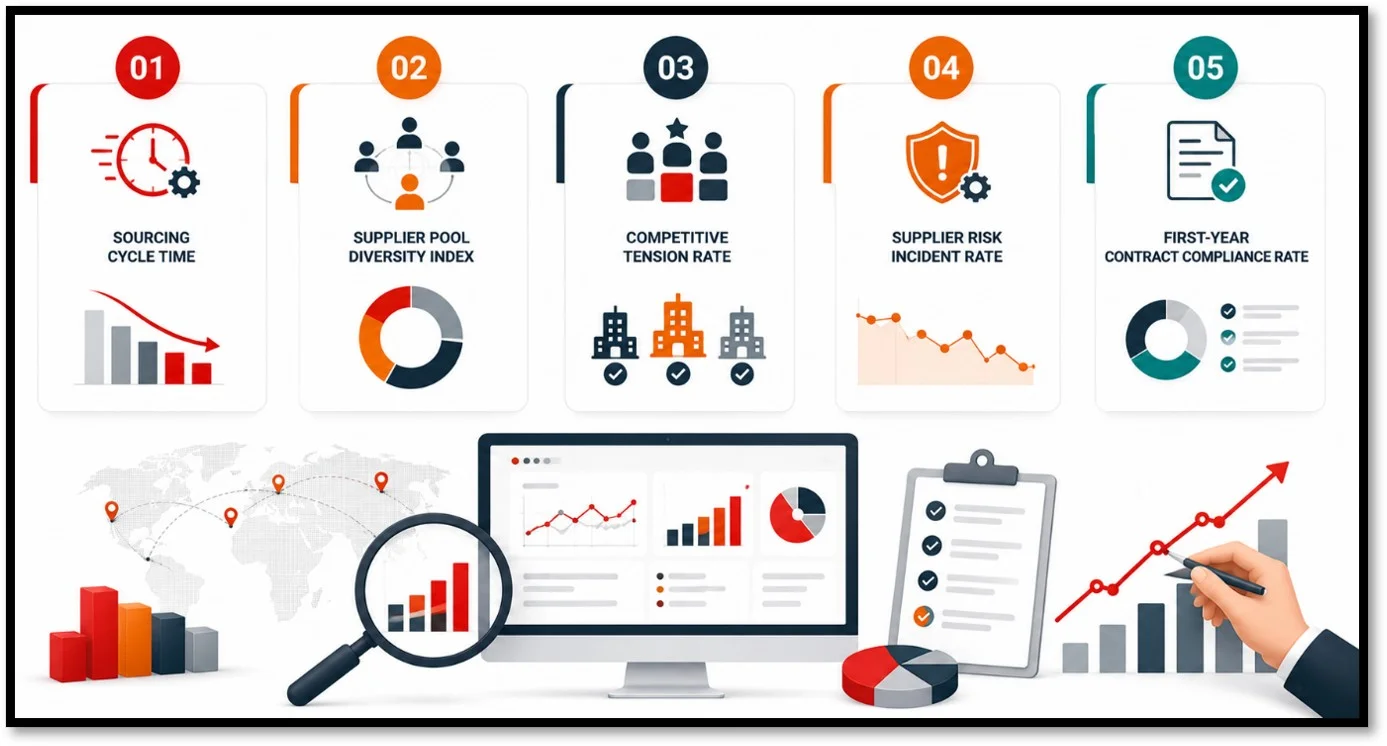
Procurement metrics create a meaningful before-and-after comparison that justifies investments in procurement frameworks. Here are five metrics that accurately capture buying networks’ value:
- Sourcing Cycle Time: It accounts for category complexity differences when measured per category, and it is the most immediate network impact indicator.
- Supplier Pool Diversity Index: It evaluates the structural possibility of competitive tension by monitoring the presence of qualified suppliers in each category.
- Competitive Tension Rate: It is a structural condition producing cost improvement, where the percentage of sourcing events with three or more qualified bidders is monitored.
- Supplier Risk Incident Rate: It measures disruption frequency of network-sourced vendors against pre-network baseline and bolsters supplier scorecards.
- First-year Contract Compliance Rate: It monitors the number of contracts where supplier performance matched agreed norms.
B2B enterprises that report all procurement performance metrics with pre-adoption baseline produce a defensible ROI case, while functions relying only on cost-saving as a key metric act as an anecdote.
Cost-saving is deliberately omitted because it is not an independent input, and teams that measure the metric without understanding the underlying mechanics often chase unreliable numbers every quarter.
What Are Supplier Performance Metrics and KPIs, and How They Feed Procurement Decisions
Supplier-level performance data governs category-level metrics, and that is why strong supplier performance metrics form the foundation of better procurement decisions. Quality rate, financial stability, delivery reliability, and responsiveness are the most valuable metrics.
However, their value depends on whether they are continuously tracked. Performance scorecards create value only when they reflect suppliers’ current operating reality. Gitnux’s 2023 survey found that 76% of companies were affected due to supplier failure.
B2B teams who treat scorecards as a live signal instead of an annual report can prevent supplier degradation before it causes disruption.
Which Are the Procurement Dashboard Metrics to Monitor, and How They Support Decision-making
While the reporting dashboard summarizes the activity in the last quarter, the decision-making dashboard surfaces actionable tasks in the current week, including declining performance trends. The former looks backwards, whereas the latter measures forward-looking procurement KPIs.
Enterprises often design their dashboards to satisfy a quarterly business review instead of informing sourcing decisions. This implies that these dashboards measure the wrong sourcing performance metrics and the incorrect cadence.
Instead of becoming a reporting exercise, ideal dashboards should guide procurement decisions. If they fail to influence sourcing behavior, they probably are monitoring the wrong metrics.
Why Is Supplier Benchmarking Important, and How to Measure Procurement Performance
While internal procurement parameters monitor the improvement in performance, procurement benchmarking answers whether the organization is performing above the market threshold.
Internal Y-o-Y comparison does not have any external reference, and it reflects improvement despite the function falling behind in the market. Therefore, it is the most unreliable procurement performance claim, yet it is the most commonly used metric.
Benchmarking should focus more on validating procurement strategy than replacing it. Decision consistency determines procurement maturity more holistically than siloed strategic sourcing metrics.
Final Thoughts: Which Are the Best Procurement KPIs for Sourcing Teams
Sophisticated technology alone does not build a defensible ROI case for procurement. It requires a measurement framework built around five outcome-oriented metrics, continuously fed by supplier performance data, and validated internal progress against industry benchmarks.
Procurement analytics enhances sourcing decisions only when metrics become actionable.
As procurement intelligence enriches and B2B buying networks deepen, B2B teams that have a disciplined measurement framework will justify future investments in technology, deliver measurable commercial outcomes, and bolster supplier performance.
Want to build a framework around metrics that can defend your budget? Contact Marketboats to identify the procurement KPIs that drive actionable sourcing decisions rather than satisfying quarterly business reviews.
FAQs
1. What are the most important procurement KPIs?
Total cost of ownership, supplier diversity, contract compliance, supplier risk incidents, and sourcing cycle time are the most important procurement KPIs.
2. How can procurement analytics improve sourcing decisions?
Supplier trend identification, performance measurement, risk reduction, and support for more informed supplier selection are the steps in procurement analytics that can improve sourcing decisions.
3. How do buying networks improve procurement efficiency?
Buying networks emphasize better supplier discovery, accelerated sourcing cycles, continuous performance monitoring, and stronger supplier intelligence that can improve procurement efficiency.