
AI-powered supplier discovery enables B2B teams to quickly identify qualified suppliers, reduce sourcing risks, and enhance supplier intelligence, making it the future of B2B buying networks.
Trax’s research finds that 66% of B2B Buyers use AI for supplier research; however, many enterprises still favor traditional procurement and manual supplier discovery. Vendor identification relies on nurtured relationships, keyword-based searches, and fragmented datasets in manual research, and it never reflects the best available suppliers.
Large supplier volume hardly creates the value that better-matched vendors can achieve. AI supplier discovery adds commercial value through relevance and verification quality. The shift from manual to automated vendor discovery improves the information quality, describing selection accuracy rather than research efforts.
How AI-Powered Supplier Discovery Works, and What Makes It Structurally Different
Manual sourcing follows the sequence of supplier identification, information gathering, employing due diligence practices, comparing outcomes, and then building a shortlist. AI procurement, on the other hand, aggregates signals simultaneously and employs matching logic against each buying category requirement.
However, speed is not the metric procurement teams should follow; instead, it is the shortlist-to-award conversion rate, which reflects match quality rather than discovery speed.
High-quality shortlisted vendors require less due diligence, which becomes the most valuable commercial benefit. According to Boston Consulting Group’s 2025 report, B2B teams can save up to 15% of procurement costs due to AI-driven supplier discovery.
Beyond automating evaluation steps, AI-driven supplier discovery compresses the evaluation stage by enhancing input quality.
What Are the Benefits of AI Supplier Discovery Beyond Speed and Cost Reduction
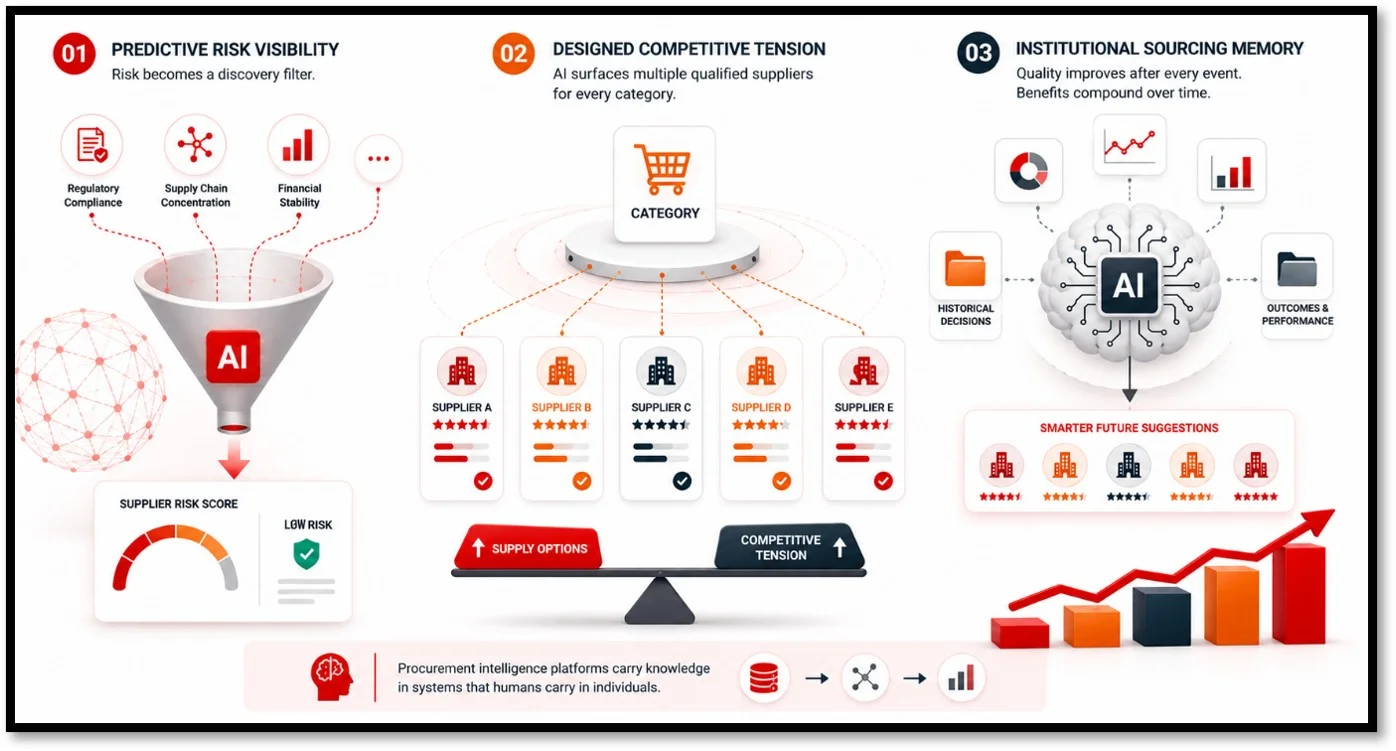
Here are the three key advantages that differentiate AI in procurement from conventional cost and speed arguments that most technology discussions revolve around:
- Predictive Risk Visibility: AI assigns a risk score before due diligence by aggregating regulatory compliance, supply chain concentration, and financial stability, and this is how risk becomes a discovery filter.
- Designed Competitive Tension: AI creates a sustained competitive tension by surfacing multiple qualified suppliers for every category.
- Institutional Sourcing Memory: This is, perhaps, the most ignored benefit, where AI enhances future suggestions by analyzing historical decisions, and quality improves after every event. Its benefits compound, making AI-driven vendor discovery more valuable over time. Procurement intelligence platforms carry knowledge in systems that humans carry in individuals.
What Are the Best AI Tools for Supplier Discovery and What Should They Actually Do
The majority of platforms that dress as AI-sourced vendor discovery platforms are actually databases with better search capabilities. A genuine platform for procurement analytics surfaces latent supplier options that buyers would not have found.
The best supplier intelligence platforms should answer all the following three questions:
- Do they learn from sourcing history to improve?
- Do they flag risk signals continuously, or only during onboarding?
- Do they integrate into the current system to embed intelligence in the workflow?
Discovery itself implies surfacing qualified vendor options beyond existing knowledge. If a platform can achieve this, it is a worthy platform, and if not, it is only enhancing known-supplier evaluation instead of discovery.
What Is the Future of B2B Buying Networks in an AI-driven Procurement Environment
The future of B2B buying networks lies in augmenting human judgment rather than replacing it. B2B enterprises that use AI to replace judgment will make quicker, yet inaccurate decisions.
Real-time supplier health monitoring will be the foremost trend, where buyers will receive continuous signals on compliance, operational disruptions, and financial status.
AI-driven supplier matching will be another trend, where intent-based discovery will eventually replace supplier directories and keyword research. Based on business requirements, AI will recommend vendors according to their commercial fit, risk tolerance, and historical performance.
Cross-network supplier sourcing intelligence will help cutting-edge buying networks aggregate anonymous supplier performance data across multiple sourcing events. B2B teams will get market-wide performance benchmark access, expanding beyond internal supplier intelligence.
Beyond adoption speed, the first-mover advantage in AI-driven networks is about the quality of the intelligence layer.
Final Thoughts: How to Find Suppliers Using AI Without Sacrificing Selection Quality
Digital procurement and AI-driven vendor discovery improve the quality of information behind procurement decisions, instead of accelerating the decision itself, producing a strong sourcing advantage.
While speed-driven teams will improve operational efficiency, intelligence-centric enterprises will improve their selection accuracy, which will govern the risk incident frequency, contract compliance, and the total ownership cost.
B2B enterprises investing in AI-powered procurement solutions now will compound their sourcing advantage, defining their category cost position. Marketboats will help you build your sourcing edge by improving on supplier discovery platforms.
FAQs
1. What is AI-powered supplier discovery?
Using artificial intelligence (AI), AI-powered supplier discovery identifies, evaluates, and ranks vendors based on their performance, risk exposure, business requirements, and compliance.
2. How does AI improve supplier discovery?
AI analyses multiple supplier data streams simultaneously to improve supplier discovery. It also helps procurement teams quickly identify better-qualified suppliers.
3. How do buying networks improve procurement?
Buying networks reduce sourcing efforts, increase procurement efficiency, expand supplier visibility, and improve supplier intelligence to elevate procurement standards.