
Beyond tracking more GTM KPIs, the answer to driving business growth lies in measuring fewer, yet better-chosen metrics that predict what will happen in the future. However, most B2B teams use vanity metrics and ignore revenue forecasting KPIs that actually drive business growth.
Pipeline 360’s research finds that only 50% of B2B enterprises prioritize revenue metrics as their primary KPI. Measuring what is convenient and easy to report is more common than tracking commercially vital parameters.
Rather than confirming commercial behavior, GTM performance metrics should change it. Their primary objective should always be to shorten decision-making. Early-surfacing metrics often create more value, and their commercial vitality lies in the action they trigger.
What Are GTM Metrics in B2B, and How to Build a GTM Metrics Framework
Two categories broadly form B2B GTM metrics, namely leading and lagging indicators. As they are easy to collect and report, most dashboards over-index on lagging indicators. From demand generation to expansion, one leading indicator is assigned for every funnel stage to build the GTM metrics framework.
When every KPI is connected to a specific decision, only then does it offer commercial value. Beyond revenue metrics themselves, the commercial outcome depends on GTM performance. Instead of improving performance, lagging KPIs describe underperformance only after the opportunity to fix it passes.
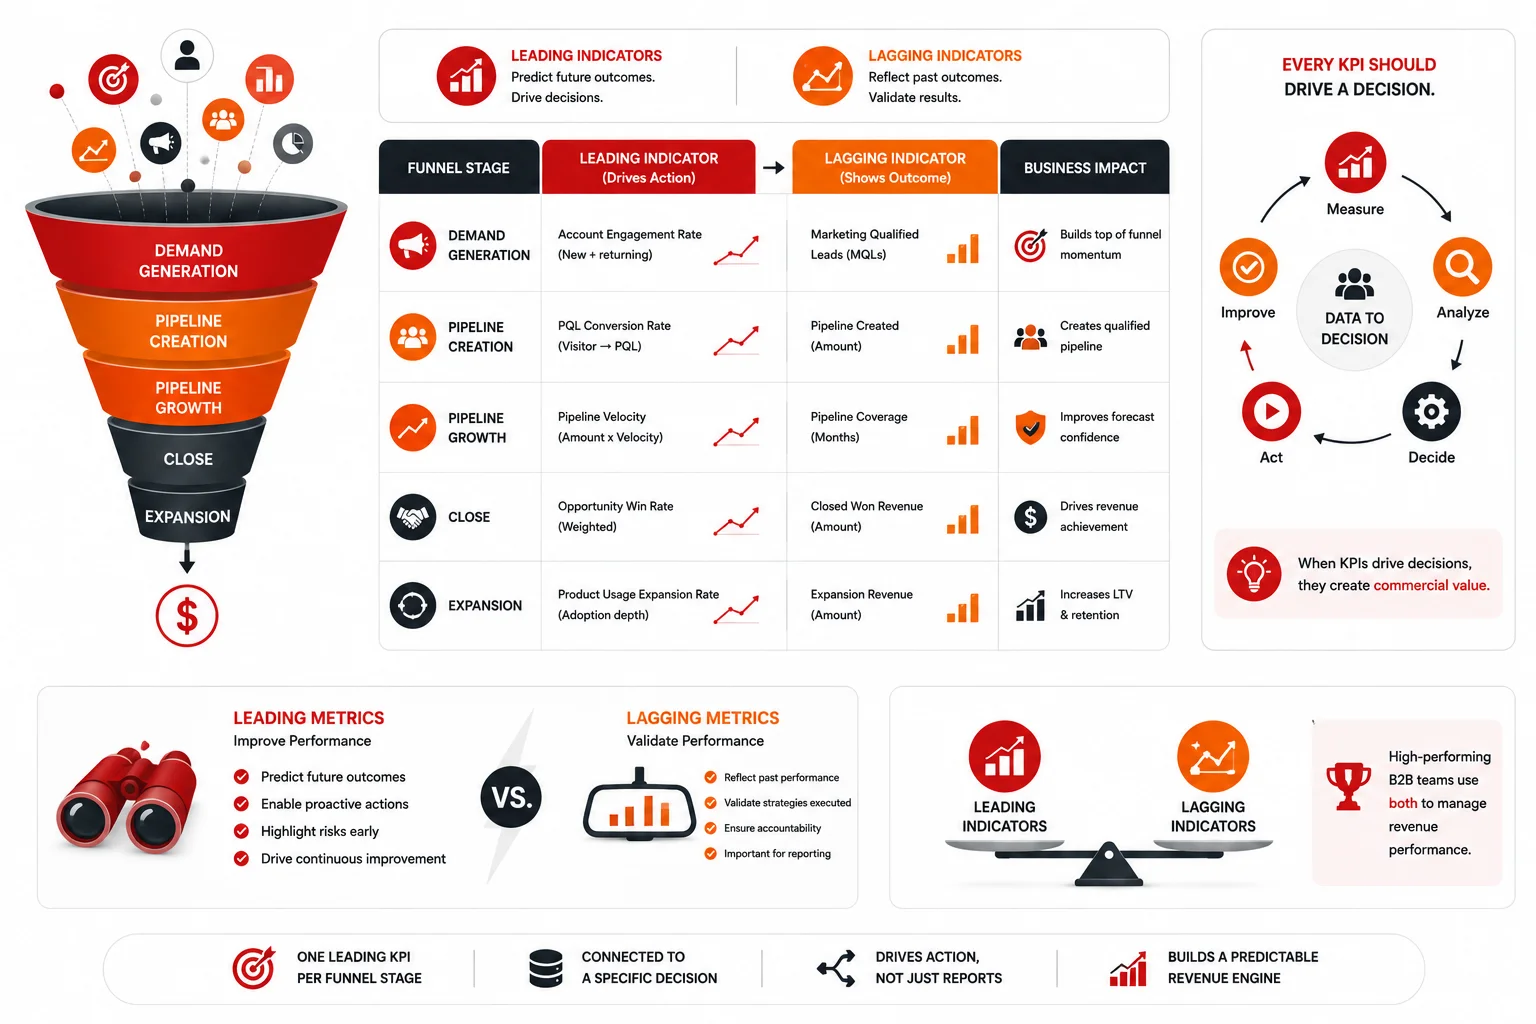
High-performing B2B teams often track KPIs that forecast revenue before it vanishes. While leading KPIs enhance decisions, lagging metrics validate them. The framework for revenue performance management needs both metrics.
How to Measure GTM Performance Beyond Vanity Metrics
Although reported more often, the win rate is the least actionable KPI because it is not an output of any independent input. B2B enterprises that optimize for win rate by ignoring its upstream drivers often overlook the cause while solving the problem.
Here are the most valuable four pipeline health metrics surfacing commercial decisions:
- Pipeline Velocity Metrics: It connects pipeline activity with revenue timing, and distinguishes a healthy pipeline from a large one. Before knowing the coverage ratio, B2B teams must know their velocity number.
- Stage Conversion Rate by Source: It unveils pipeline leakages and identifies if these leaks are universal or channel-specific.
- Lead-to-Opportunity Conversion Rate: It is a handoff quality metric between marketing and sales teams, and a declining rate often indicates a qualification problem. Digital Bloom’s research finds that the average lead-to-opportunity conversion rate is between 2 and 5%.
- Opportunity-to-Close Rate: A declining rate suggests a failure of multi-stakeholder engagement.
How to Track B2B Marketing KPIs, and How to Measure Revenue Performance in B2B Marketing Using KPIs That Matter
Although most B2B enterprises only report cost per lead (CPL), treating it as a revenue metric, in reality, it is a volume KPI. The channel that shows low CPL and produces no pipeline results is an inefficient use of budget.
Here are four commercially efficient metrics that connect marketing budget to revenue outcomes-
- Customer Acquisition Cost (CAC): Instead of aggregating, it is measured per channel, because average CAC masks unacceptable unit economics. Marketing teams often avoid this metric because it reveals which channels dress as commercially sustainable acquisition models without adding real value.
- CAC to LTV Ratio: Anything below 3:1 indicates that the acquisition model acquires buyers at a higher cost than the relationship can withstand.
- Net Revenue Retention (NRR): A number above 100% indicates that only the current buyers’ group is growing revenue. As the metric reveals whether acquired customers stay, generate revenue, and expand, it gives the most honest measure of GTM strategy.
- Customer Churn: It reduces the cost of replacing lost buyers to bolster future revenue predictability.
Expansion revenue metrics, NRR, and churn rate are the KPIs that monitor what the GTM motion has actually built. GTM success can hardly be described based on revenue growth that does not produce retention. Increasing customer value after acquiring them often produces sustainable growth.
Beyond tracking only customer acquisition, B2B performance metrics that measure customer expansion are the strongest revenue metrics.
Final Thoughts: How to Define KPIs for B2B Growth
B2B marketing KPIs become commercially valuable only when every metric connects to a specific decision that revenue teams can still influence.
Every KPI should be tied to two accountable decision-makers, one monitoring it, and one acting on it. A quarterly-reviewed GTM dashboard is only a historic document, but a model reviewed every week forms a commercial decision system.
Marketboats can help you build a framework for KPIs for B2B growth that transforms commercial decisions rather than only confirming them.
FAQs
1. Which KPIs matter most for B2B growth?
KPIs that matter the most include pipeline stage conversion rates, lead-to-opportunity conversion rate, net revenue retention (NRR), CAC, opportunity-to-close rate, CAC-to-LTV ratio, and pipeline velocity.
2. What are leading vs lagging KPIs?
While leading metrics forecast revenue performance, lagging KPIs monitor completed outcomes. The former includes conversion rates and pipeline velocity, whereas the latter emphasizes MRR, ARR, quota attainment, and revenue.
3. How does AI improve KPI tracking?
AI monitors real-time buyer behavior, forecasts pipeline performance, highlights metrics that matter the most, identifies anomalies, and automates reporting methods to improve KPI tracking.