
A marketing report is a decision document that tells leadership what happened, why, and what to do now. Marketing teams can track campaign activity across different channels, build dashboards for various metrics, and monitor lead generation.
Reporting answers ‘what happened’ and leaves leadership with new questions: what changed, what caused it, and whether we should still invest in the program. The gap lies between collecting performance data and assessing commercial impact.
According to a MarketingProfs study, B2B marketing teams spend 24% of their time collecting data, and only 18% presenting it. Adding more dashboards and more frequent reporting might not lead to accurate decisions.
If you want to report effectively, you must ensure that campaign performance and its business implications are clear to both clients and internal stakeholders. Your report can influence budget decisions, and its value depends on the decisions it helps stakeholders make.
What to Include in a B2B Marketing Report
A B2B marketing report follows a structure that moves from an executive summary to objectives, KPI performance, channel and account analysis, insights, and next steps. Every section you include in the report should solve readers’ specific questions, and you can use the framework to report monthly reviews or quarterly business updates.
| Report Section | What Should be Included | Which Question It Answers |
| Executive Summary | Main result, reason for the change, and decision required. | What is the headline? |
| Business Objectives | Agreed business goals and campaign targets. | Are we measuring the right outcomes? |
| KPI Performance | Relevant context, previous-period trends, and actuals against targets. | Did we achieve the expected result? |
| Channel and Account Analysis | Engagement across target accounts, conversion patterns, and channel-level pipeline. | How did we get results? |
| Actionable Insights | Risks, contributing factors, and an explanation of why performance changed. | Why did the results change? |
| Next Steps | Top priority actions, deadlines, and owners. | What should happen next? |
Including every available metric can bury the key finding leadership should act on. As a result, metrics you include in the report should depend on your campaign goals, and each section in the report should either support a decision or answer a stakeholder question.
For example, you can report a content syndication program with lead acceptance, delivery, and qualification measures, while a demand generation campaign might require opportunity and pipeline metrics.
Marketboats follows a straightforward reporting principle that makes delivery and its commercial consequences clear to internal stakeholders and clients. However, a good reporting template can fail for multiple reasons.
Why Marketing Reports Fail to Influence Decisions
When you describe activity in your report and leave decisions to readers, your marketing report may not influence decisions. Even with comprehensive channel data, accurate figures, and detailed charts, marketing reports may inform readers but fail to drive decisions because they do not explain what needs to change.
| Where Reports Fail | What Can You See | How Can You Fix This |
| Different Data Definitions | Marketing and sales disagree on definitions of conversions, leads, and pipeline. | Sales and marketing teams should agree on calculation rules, reporting periods, and metric definitions. |
| Vanity Metrics | Clicks, downloads, and impressions lead the report without a connection to campaign objectives. | Lead with revenue and pipeline contribution metrics, and use activity metrics to explain performance. |
| No Recommendation | The report offers no concrete actions or explanations. | Suggest the required decision and the evidence supporting it. |
| Reporting Cadence Misses the Audience | Stakeholders receive data with no clear summary. | Match reporting details and frequency with decisions made. |
Zipdo’s 2026 research finds that 55% of B2B enterprises face data silos as a primary integration challenge, while data quality affects 49% of integration projects. Data is an easy target to blame, but very few agree on which decisions the marketing report should support.
Your reporting should make campaign outcomes understandable, and stakeholders, including clients who need to evaluate lead quality and campaign delivery, should find a clear action to take.
Disagreements between marketing and sales teams often turn into arguments over definitions. If the report can convey to readers what has changed and why it matters so much, it has passed the first test. You can improve your marketing reports by discussing reporting objectives and decision requirements with leadership.
How to Present Marketing Results to Leadership
You should start a marketing report presentation by outlining leadership’s goals, then demonstrating pipeline impact, and ending with a clear request. This report should help stakeholders decide whether to reduce the plan, adjust it, or continue as planned.
The following five-step framework can help you present a marketing report to stakeholders more effectively:
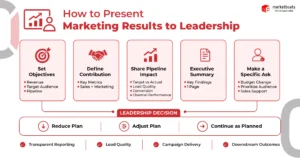
- Ask leadership to define objectives. Find business priorities that your report must include, such as revenue contribution, demand from a specific audience, and pipeline creation.
- Agree on how the marketing function will contribute. Clearly define metrics that will measure progress, and how sales and marketing teams will define influenced and sourced pipeline.
- Lead with pipeline context and results. Start by mentioning performance against the agreed target. Further, explain changes in lead quality, conversion, and channel performance.
- Make the executive summary comprehensive and limited to one page. Mention your key findings with a small set of priority metrics on a single page. You can prepare a separate operational report for detailed channel-level charts, or move them to appendices.
- End with a specific ask. Clearly mention what you want from the leadership, whether it be approval for a budget change, prioritizing an audience, or support for a sales follow-up process.
Your leadership does not want you to overstuff metrics while presenting. Executives want you to help them decide the next course of action. A polished dashboard rarely fixes the mismatch between leadership priorities and marketing metrics.
Your reporting should be transparent to stakeholders while reporting lead quality, campaign delivery, and downstream outcomes.
Setting the goal and success metrics first in a meeting helps you prepare a report that is easier to approve because you know the objective and definition of success beforehand. Marketboats suggests a specific presentation order: goals, lead volume, lead quality, pipeline impact, and a clear CTA.
How Is AI Changing B2B Marketing Reporting
AI predicts outcomes, flags anomalies, and prepares the preliminary version of your report. According to Goodfirms’ 2026 research, 83% of B2B enterprises use AI across multiple functions.
However, despite its speed, AI cannot predict what your leadership will ask for this quarter. As a result, AI cannot guarantee better interpretation and recommendations.
| AI Capability | What Can AI Do | What Humans Should Verify |
| Predictive Marketing Analysis | AI analyses historical data and predicts conversion trends and pipeline. | Humans compare actual outcomes with forecasts to identify when the model becomes unreliable. |
| Anomaly Detection in Marketing Data | AI can flag unusual movements, such as leads suddenly dropping or conversion rates changing drastically. | Humans can analyze whether the cause is a real performance change, an incomplete data feed, or a tracking anomaly. |
| Natural-language Marketing Analysis | AI drafts performance commentary and answers questions in natural language. | Humans confirm the context, validate metrics, and ensure recommendations follow evidence. |
Marketboats balances AI integration with human judgment. While AI accelerates analysis and speeds up operations, humans interpret the results and draw conclusions. Data quality in AI reporting determines the quality of the AI-powered marketing report.
Fixing source quality should be the first step in improving reporting. Automate repetitive analysis where needed, and keep human intervention for context and decisions. For many B2B lead generation companies, the report itself can be part of the deliverable.
What a Lead Generation Vendor Report Should Include
Ideally, every lead generation vendor report should include HQL rate, pipeline influence, lead rejection reasons, account coverage, and lead acceptance. While delivered-lead counts show volume, they rarely reflect quality because they omit lead acceptance and rejection.
As a result, a high lead-delivery count alone may not reflect campaign effectiveness. While reviewing a vendor’s reporting format, you can use the following checklist:
| Metric | What It Tells You | What Should You Ask the Vendor |
| HQL Rate | It describes the number of leads that meet the agreed qualification threshold. | Which criteria did you check, and how did you document the compliance? |
| Pipeline Influence | It surfaces opportunities related to campaign touchpoints, reported under an agreed definition of attribution. | How does the report classify pipeline as sourced or influenced, and how is it determined? |
| Reasons for Lead Rejection | It explains why leads are rejected or categorized under agreed rules. | Can we review lead-level details and the reason codes? |
| Account Coverage | It shows how many contacts have been reached across target accounts. | Which accounts and buying-group roles were engaged? |
| Lead Acceptance | It tells you how many of the delivered leads the buyer’s team has accepted. | How is acceptance calculated, and who confirms it? |
Before you sign a content syndication or lead generation agreement, review a sample report and check whether it contains qualification criteria, rejection reasons, definitions used for downstream outcomes, reporting frequency, and lead-level detail.
Instead of resolving post-delivery gaps, agree on requirements before starting the campaign. Evaluate a vendor based on delivered volume and clear, traceable reporting.
Summary: How to Turn Marketing Data Into Actionable Insights
You should ask a decision-focused question before building a marketing report that turns data into actionable insights. Agree on objectives with leadership, report pipeline impact rather than activity alone, and use AI to handle repetitive reporting tasks.
Frequent reporting rarely solves disconnected data or unclear objectives; instead, consolidate decision-oriented and transparent campaign reporting. You have successfully prepared a functional report when it helps leadership understand what is changing or what actions to take.
Marketboats can help you build such a report that reflects HQL rate, account coverage, and lead acceptance.
FAQs
1. What should a B2B marketing report include?
An ideal B2B marketing report should include an executive summary, business objectives, KPI performance against targets, channel and account analysis, actionable insights, and next steps, in that order.
2. How often should B2B marketing teams report?
The right reporting frequency and cadence depend on data availability, campaign duration, and how often stakeholders need to make decisions. Many B2B enterprises use monthly reports for campaign performance and operational adjustments, and quarterly reports for broader strategic and leadership reviews.
3. What is the difference between reporting and analytics?
Reporting organizes and communicates performance data against predefined targets, while analytics investigates relationships, possible explanations for results, and patterns.
4. Which tools are used for B2B marketing reporting?
You can use Tableau, Looker Studio, or Power BI for dashboards and visualization, HubSpot and Salesforce for CRM and marketing data, and GA4 for website and traffic analysis. Platforms like Improvado and HockeyStack support specialized B2B marketing analytics and data integration needs.
5. What should a lead generation vendor report show?
An ideal lead generation vendor report should include measurable pipeline influence, lead acceptance, rejection reasons, account coverage, HQL rate, and delivered leads.