
ABM ROI measures the return an ABM program generates relative to its total investment, calculated as the percentage difference between revenue and total program cost. Mathematically, you can calculate ABM ROI as:
| ABM ROI = | Total Revenue − Total Program Cost | × 100 |
| Total Program Cost |
However, the result can vary depending on which revenue you count. An ROI report based on unagreed influence rules or partial costs will not produce accurate figures. Your influenced pipeline does not necessarily represent realized revenue.
According to ContactLevel’s 2026 research, 20-30% of your total advertising budget should be dedicated to contact-level ABM. Your ROI calculations depend on the costs included in the program and the returns stakeholders agree to measure.
When leadership clearly defines those benchmarks, ROI becomes more commercially meaningful. The calculation itself may take only a few hours, but agreeing on definitions often requires cross-functional discussion. Marketboats believes finding ABM ROI requires a calculation basis and well-documented cost inputs.
What Is the ABM ROI Formula, and How to Calculate It
The ABM ROI formula compares the net returns from an ABM program against its total cost. Reporting closed-revenue ROI separately from pipeline-influenced value can give stakeholders a clearer view of realized returns and potential commercial value.
According to Directive’s illustrative example, suppose a B2B enterprise invests $200,000 per quarter in an ABM program. You, as a marketer, identify $400,000 in closed revenue and $1,200,000 in ABM-influenced pipeline. Let us have a look at an example explaining why two views should be presented side-by-side:
| Measurement view | Return counted |
Calculation | ROI |
|---|---|---|---|
| Pipeline-influenced ROI (Indicative) | $1,200,000 | ($1,200,000 − $200,000) ÷ $200,000 × 100 |
500% |
| Closed-revenue ROI | $400,000 | ($400,000 − $200,000) ÷ $200,000 × 100 |
100% |
Results can be misleading if you choose only one view. Closed-won revenue ROI arrives late and uses closed-deal revenue from the reporting period. In contrast, pipeline-influenced ROI flatters the program and reflects potential value under the attribution method used.
Do not treat these two metrics as interchangeable because they represent commercially different outcomes. A report that mentions only pipeline ROI can overstate the financial outcome already realized. On the other hand, reporting only closed-won revenue might mask the deal progress when accounts are in the sales pipeline.
Marketboats believes every ABM ROI report should show both views side by side, with each view clearly defined, and every reported ROI percentage should have a well-documented calculation basis.
Which Costs Should Be Included in ABM ROI
When calculating ABM ROI, include all program costs, including variable campaign spend, fixed infrastructure, and indirect costs like training, overhead, and staff time. Clearly mentioning which costs are included in the total cost will make calculations more credible.
| Cost Category | Examples | Reporting Consideration |
|---|---|---|
| Fixed Infrastructure | Intelligence tools, automation, and ABM platforms. | Consistently assign shared costs across periods and programs. |
| Variable Campaign Spend | Campaign execution, content production, and paid media. | Attribute costs to the relevant programs. |
| Internal Resources | Time spent on operations, sales, and marketing. | Use a consistent method to calculate hourly staff costs. |
| Supporting Costs | Relevant overhead and training. | Include costs where the predefined methodology needs them. |
Ignoring staff time to inflate ROI can make your reporting figures look impressive, but it can hurt the report’s credibility when finance rebuilds the number. To avoid this, RevOps and finance teams must agree on the rules before starting reporting.
A more practical approach is to forecast the relevant team’s hourly cost, document how you calculate it, and reuse this method every quarter. Beyond precise-looking ROI figures, consistent cost accounting can be more commercially meaningful.
A higher ROI that falls apart during an audit is far less useful than a defensible lower ROI. Ask a vendor how their ABM program costs are allocated when you evaluate an ABM partner.
How Are Engagement Metrics Different from Revenue Metrics in ABM
While engagement metrics show whether target accounts respond, revenue metrics reveal whether that engagement progresses toward commercial outcomes. Use engagement metrics to check early whether ABM is working, and revenue metrics to prove it later.
| Metric | Type | What It Reflects | How to Track the Metric |
|---|---|---|---|
| Stakeholder Coverage | Leading | Buying-committee roles reached | It is the percentage of targeted stakeholders who have been engaged. |
| Cost Per Opportunity | Efficiency | Cost of creating opportunities | It is the ratio of the total ABM program cost to opportunities created. |
| Account Engagement Score | Leading | Account-wide interest | It is the weighted score of tracked activity, using documented weights. |
| Marketing Contribution | Lagging | Share of pipeline sourced by marketing | It is the percentage of the marketing-sourced pipeline relative to the total pipeline. |
| Revenue Per Account | Lagging | Average realized revenue from target accounts | It is the total closed revenue per account in the defined cohort. |
You should define cohort, attribution rules, and reporting period for every metric. When comparisons use consistent periods and clearly define the account population, revenue per account becomes commercially meaningful. Keep marketing-sourced pipeline and marketing-influenced pipeline distinct.
DemandBase’s 2026 research finds that increasing engagement can drive conversion, where 180-190 touches reach a 94% conversion rate. But engagement scores can be easily inflated, and higher engagement might not always indicate purchase intent for the account. A high engagement score with little opportunity behind it reflects activity.
Select one lagging and one leading metric per stage to report them collectively. You can identify realized outcomes using lagging indicators, and diagnose performance using leading indicators. Engagement is more commercially meaningful when it covers the entire buying committee.
How to Measure Buying Group Engagement in ABM
To measure buying group engagement in ABM, count how many relevant stakeholders you have reached within each target account and how their engagement has deepened over time. However, measuring only contacts can hide gaps in stakeholder coverage.
You can use the following framework to measure this engagement in ABM:
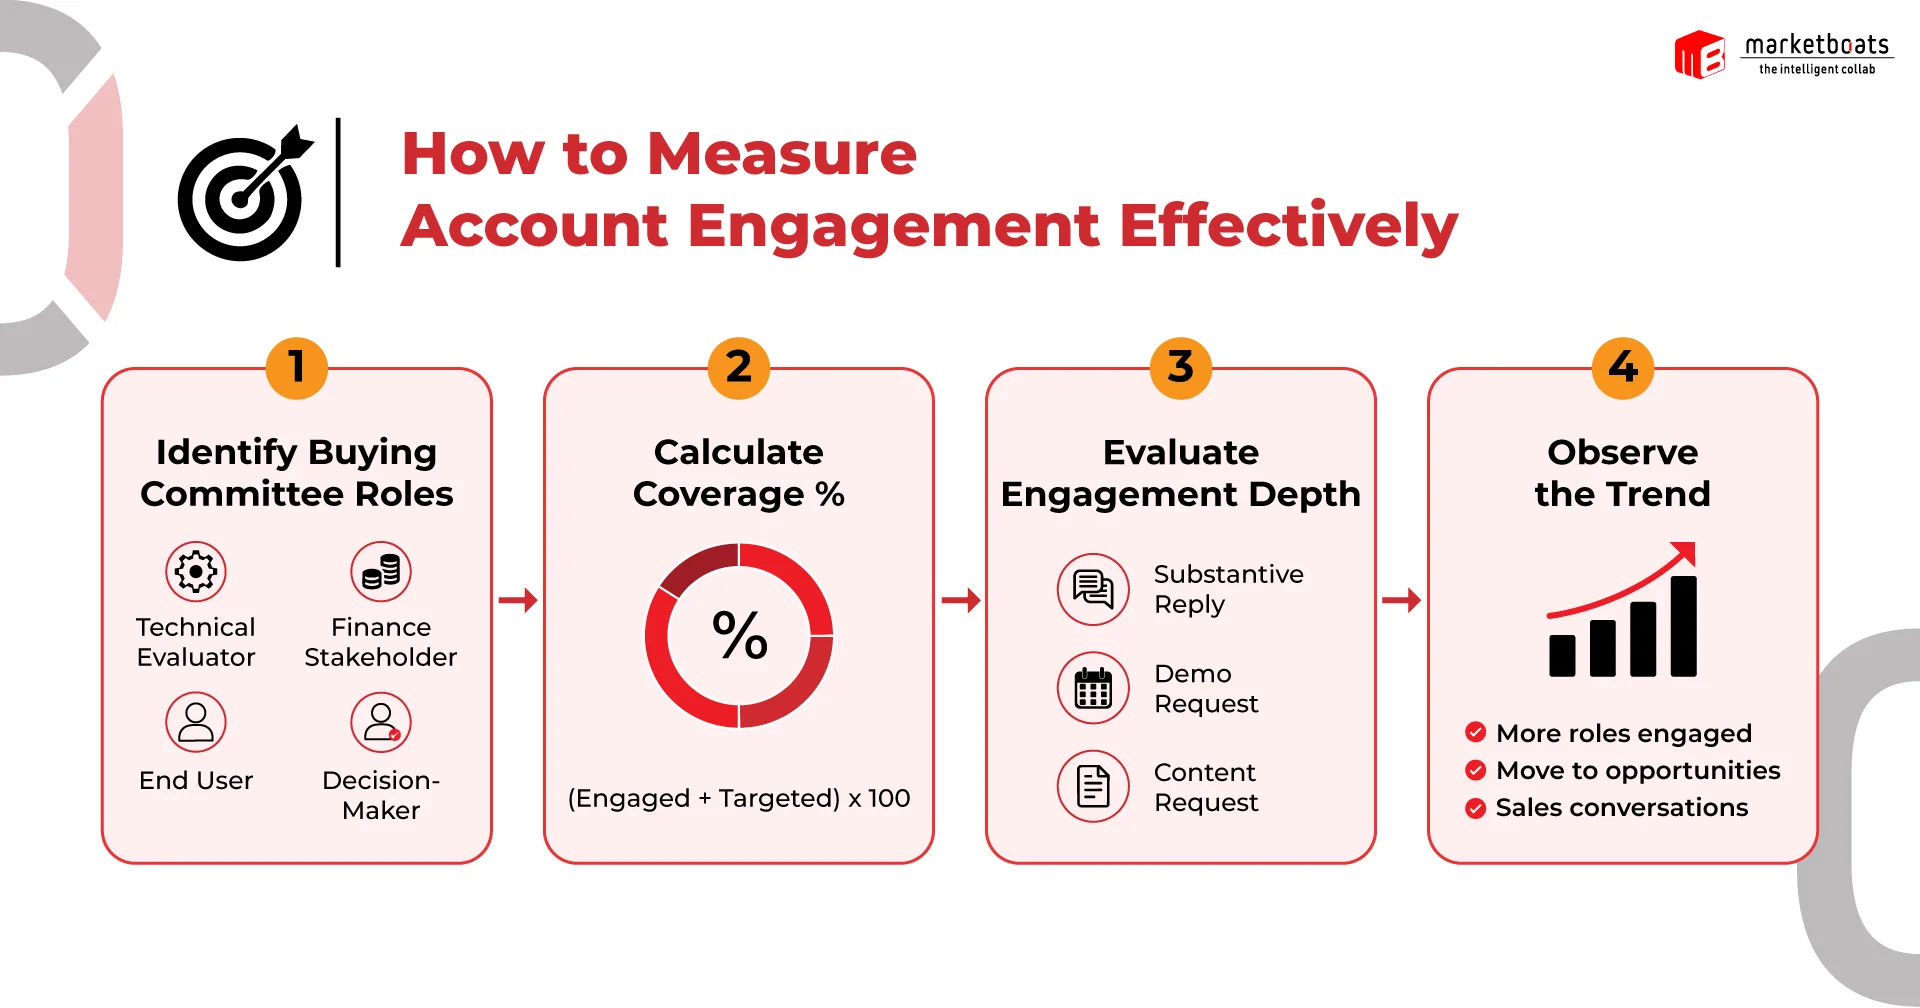
- Make a list of the relevant buying-committee roles for every account, including a technical evaluator, a finance stakeholder, an end user, and a decision-maker.
- Calculate the total coverage percentage. You can find this number by dividing the number of stakeholders engaged by the number of stakeholders targeted, and then multiplying by 100.
- Evaluate the engagement depth. For this, distinguish activity from a more commercially meaningful signal, including substantive reply, demo request, and content request.
- Observe the trend. Track whether engagement expands across relevant roles and progresses toward opportunities and sales conversations.
Repeated clicks from one contact reflect individual activity, whereas multiple roles from a single buying committee responding simultaneously can tell you about the account itself. However, neither signal fully explains purchase intent, though the latter provides a broader view of the buying group.
No universal benchmark measures the ideal number of stakeholders for every account. Still, you can set coverage expectations based on the buying process, roles relevant to the opportunity, and account complexity.
If you measure multiple-contact engagement with only one asset, you will end up tracking activity while leaving key decision-makers unapproached. Rather than only measuring active contacts, track whether you have engaged the right accounts. Coverage often takes months to build, which can raise questions about timing.
How Long Does ABM Take to Show ROI
ABM ROI typically arrives in stages: early engagement signals, then pipeline, and finally closed revenue after a full sales cycle.
| ROI Measurement Stage | What to Measure | Which Questions It Answers |
|---|---|---|
| Early | Stakeholder coverage and account engagement. | Are the relevant accounts engaging? |
| Middle | Cost per opportunity and opportunities created. | Does the engagement turn into a pipeline? |
| Later | Revenue per account and closed-won revenue. | Did the investment produce realized revenue? |
Analyzing program performance solely against closed revenue might frame a developing opportunity as a failure, because no closed revenue in the program’s early stages does not necessarily mean a failed ABM initiative. At the same time, early engagement might not justify extending an ineffective ABM program indefinitely.
To run the program and monitor ABM ROI effectively, you should align reporting windows with pipeline maturity and campaign objectives. Define the metric to report at each stage, but do not treat early metrics as final program outcomes; distinguish them from confirmed financial returns. This plan will become the backbone of your CFO report.
How to Report ABM ROI
A CFO-ready ABM ROI report should include four parts: objective, investment, impact, and learning. You should agree on your calculation standards with RevOps and finance beforehand. Use the following checklist to organize your report:
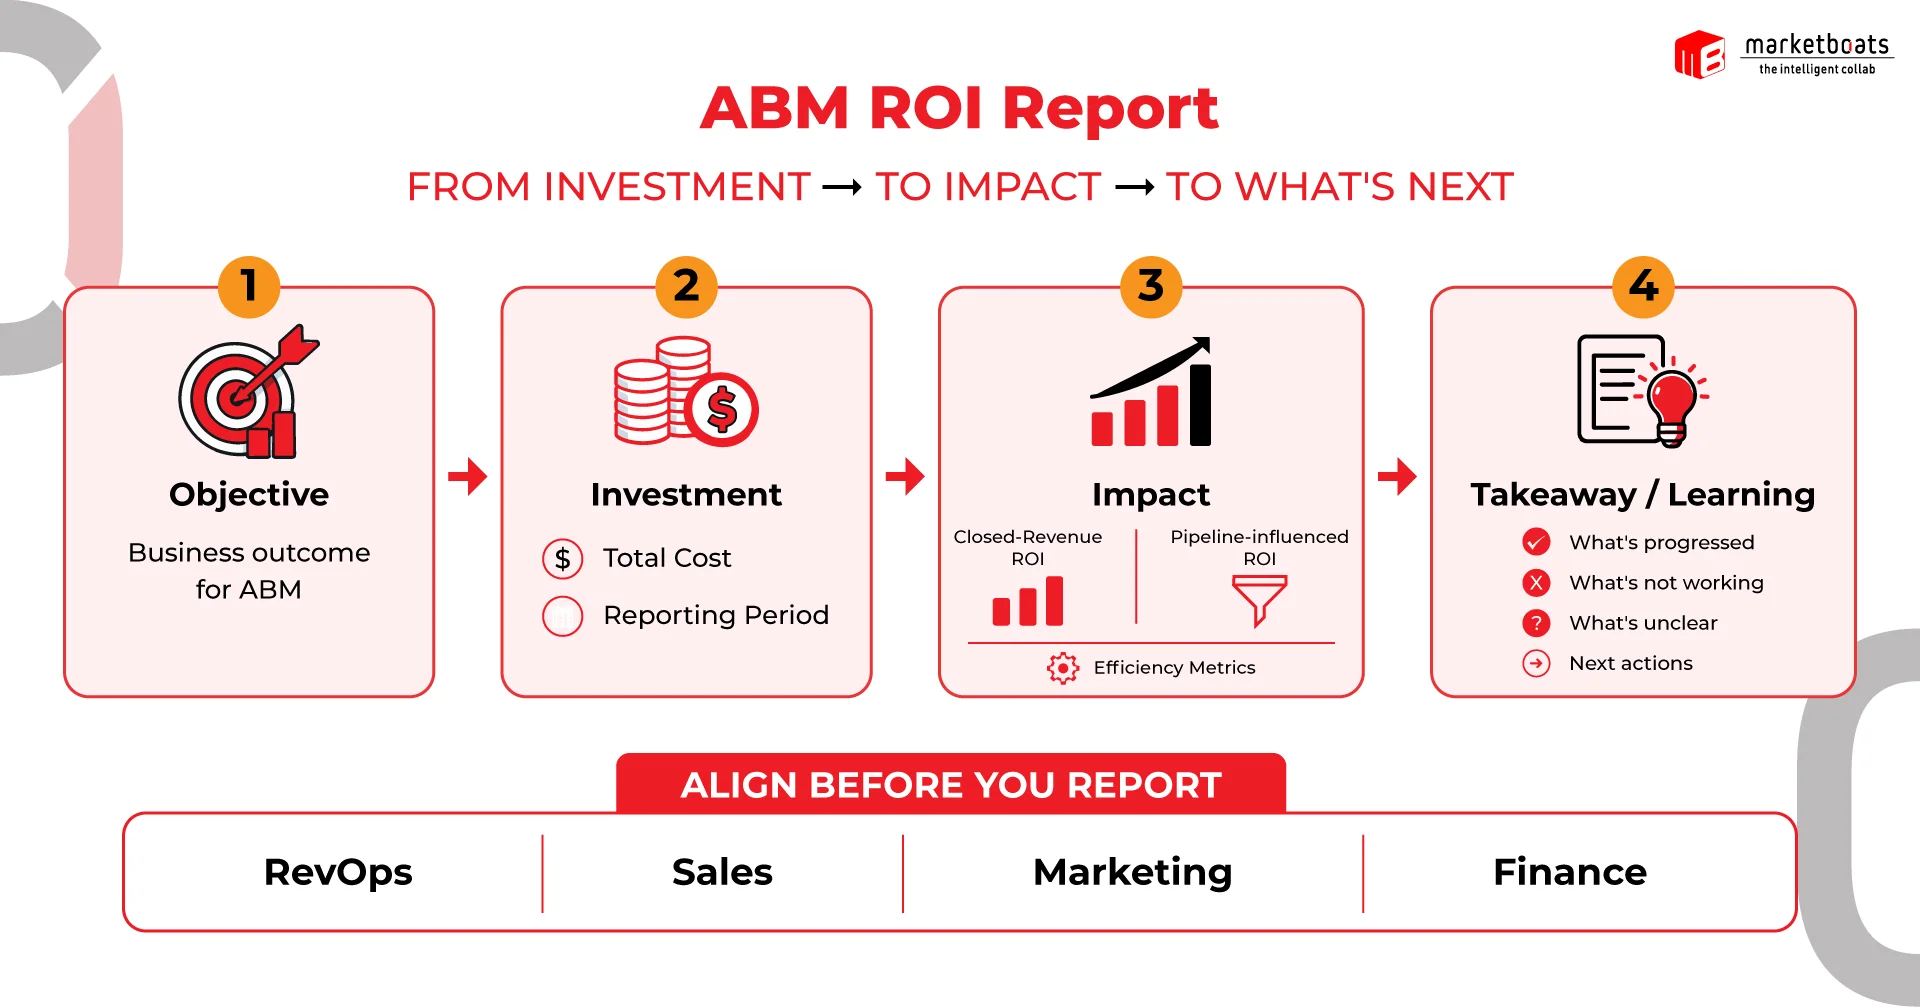
- Objective: Clearly define the business outcome that the ABM program was expected to achieve.
- Investment: Mention the entire included cost and the reporting period while calculating the ROI.
- Impact: Distinguish closed-revenue ROI from pipeline-influenced ROI, and include relevant efficiency metrics.
- Takeaway or Learning: Clearly reflect on what has progressed, what has not performed well, what is ambiguous, and what actions should follow.
B2B enterprises that rely on inconsistent assumptions often get misled by a single ROI percentage. A modest ROI supported by traceable calculations is more credible than a higher figure that cannot be reproduced.
RevOps, sales, marketing, and finance teams should agree on reporting windows, cost allocation, account cohorts, and attribution rules before you present the report to the CFO. Two teams might conclude different ROI figures if these definitions are not shared.
A CFO-ready report is often transparent about its limitations and assumptions. Sending the one-pager before the meeting will start the conversation at the decision stage.
Final Thoughts: Why Should You Make ABM ROI Comparable and Actionable
Making ABM ROI actionable and comparable reduces ambiguity so that leadership can make faster, more efficient decisions. To measure ABM ROI, use a consistent formula, two well-labeled views (closed-revenue and pipeline-influenced ROI), and complete cost inputs.
Monitor buying group coverage and engagement early, and leave measuring revenue for the later stages. You should agree on measurement standards and the reporting window with the finance team before reporting starts.
More metrics do not guarantee consistent ROI figures, and they do not compensate for inconsistent assumptions. Consolidate evidence-led measurement without promising a specific return so stakeholders can understand and reproduce the calculation.
Marketboats can help you develop such an ABM strategy with BANT-qualified accounts and reporting that you can comfortably trace.
FAQs
1. How do you measure ABM ROI?
Subtract total ABM program cost from the defined return. Then divide by total cost and multiply by 100. You should report closed-revenue and pipeline-influenced ROI with separate views and clear attribution rules.
2. What is a good ABM ROI?
There is no universal benchmark for an ideal ABM ROI. Numbers can vary based on whether the calculation uses influenced pipeline or closed revenue, sales cycle, cost allocation, account value, and investment.
3. Which metrics prove ABM success?
Key metrics that prove ABM success include revenue per account, closed-won revenue, stakeholder coverage, cost per opportunity, opportunities created, pipeline progression, and account engagement.
4. How do you measure the ROI of an ABM agency?
First, define clear objectives, qualification criteria, reporting periods, attribution rules, and costs before starting engagement. Then evaluate revenue outcomes, pipeline, and verified accounts against those defined parameters.
5. Should ABM ROI use pipeline or closed revenue?
You can use both, but you must distinguish them with clear labels. Closed-revenue ROI shows returns on won revenue within the reporting period, while pipeline-influenced ROI tracks potential commercial value tied to the program.